
GIS Data Catalog
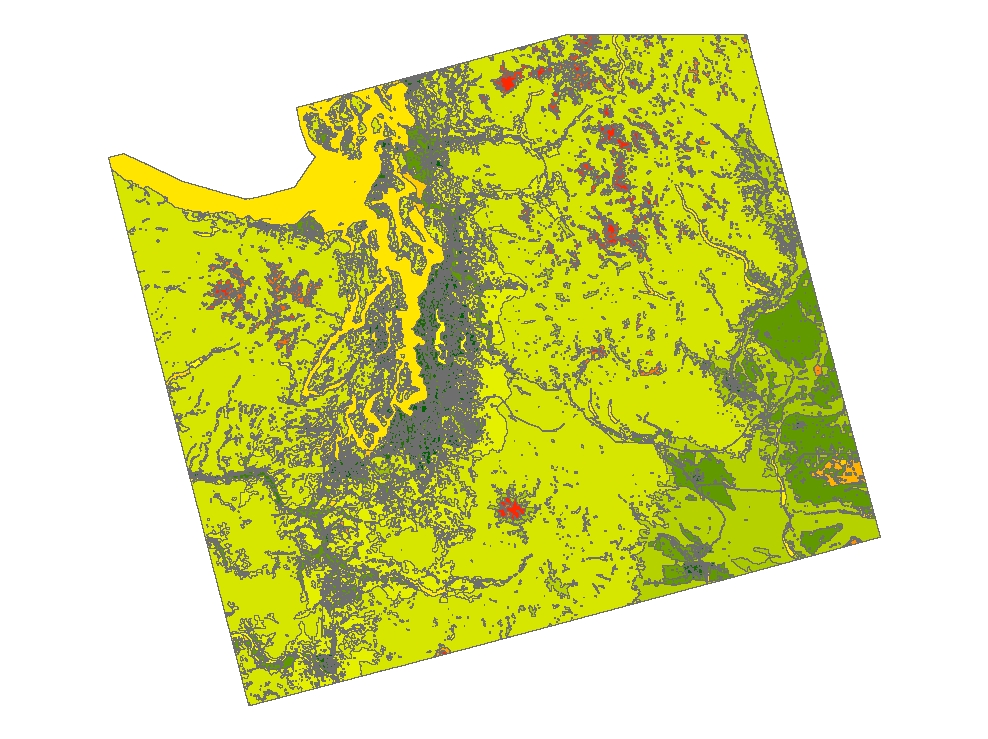
1970 Land use from 1970 data refined with 2000 population data to indicate new residential development
Learn more by reading the GIS FAQ 🗺
Summary
This is one of the ancillary GIS (geographic information system) data layers developed to characterize USGS National Water-Quality Assessment (NAWQA) sampling sites and study areas for national synthesis of water-quality data.
For background on the design of the NAWQA program see Gilliom and others (1995).
Description
This data set represents U.S. Geological Survey (USGS) historical Land Use and Land Cover (LULC) from the 1970's that has been refined with 2000 population density at the block group level to indicate new residential development representative of the early 2000's.
Any area having a population density of at least 1,000 people per square mile had been re-classified as "urban" land in this data set.
Layer information
| Layer Name | LANDCOVER_Landuse1970RefinedBy2000NewResidential |
| Subject Category | Imagery |
| Title | 1970 Land use from 1970 data refined with 2000 population data to indicate new residential development |
| Feature Count | 1 |
| Feature Type | Raster |
| Spatial reference | None |
| Control ID | None |
| Place Keywords | Conterminous United States |
| Theme Keywords | Inlandwaters, Residential Land Use, LULC, Land Use, GIRAS, Anderson Land Use/Land Cover, Urban Land Use, Land Use Data Analysis, 2000 Population, LUDA, Land Cover, Geographic Information Retrieval And Analysis System, Urbanization |
| Supplemental Information |
This data set was developed by the NAWQA program to fill a requirement for a nationally consistent land-use data base that would define where "urban" land existed during the early 2000's for comparison to a similar product prepared with 1990 population to represent the 1990's. The best available nationally consistent land-use data base available at the time NAWQA began (1992) was the LULC data that was developed by USGS under the Land Use Data Analysis (LUDA) program in the 1970's-1980's. LULC maps were delineated manually from aerial photography, and LULC codes were assigned using a hierarchical land use and land cover classification scheme described by Anderson and others (1976). The maps were published by quadrangles at scales of 1:250,000 and 1:100,000 (USGS, 1990). The native digital format of the USGS LULC data is Geographic Information Retrieval and Analysis System (GIRAS). In 1992, a similar nationally consistent LULC data base for the 1990's did not exist. NAWQA's approach was to take the 1970's LULC data as a base and then enhance it with more current, more detailed ancillary information on population (Hitt, 1994). The procedure was used first with 1990 population data. Later the same approach was used with 2000 population data. NAWQA developed a classification scheme for defining "residential" land use based on population density. The classification scheme determined "residential" land as any area with population density of at least 1,000 people per square mile (386 people per square kilometer). The procedure to refine the LULC data was to overlay the 1970's land use with 2000 population density by block group. Any area in the derivative product that met the following criteria was re-assigned a new land use code of "new residential:" (1) original LULC land use was not urban or built-up, (2) original LULC land use was not water, and (3) 2000 population density was at least 1,000 people per square mile. The ArcInfo Workstation grid is stored in the newlu00g.tgz file (gzipped tar file). The uncompressed file size of newlu00g.tar is about 109 MB. Ways to extract the grid from the .tgz archive file include TARARC, Winzip, UnStuffIt, or the following GNU utilities for WIN32: gunzip newlu00g.tgz tar xvof newlu00g.tar The grid "newlu00g" will be in a subdirectory called arctar00000. arctar00000/ arctar00000/info/ arctar00000/info/arc.dir arctar00000/info/arc0000.dat arctar00000/info/arc0000.nit arctar00000/info/arc0001.dat arctar00000/info/arc0001.nit arctar00000/info/arc0002.dat arctar00000/info/arc0002.nit arctar00000/info/arc0002r.001 arctar00000/log arctar00000/newlu00g/ arctar00000/newlu00g/dblbnd.adf arctar00000/newlu00g/hdr.adf arctar00000/newlu00g/log arctar00000/newlu00g/prj.adf arctar00000/newlu00g/sta.adf arctar00000/newlu00g/vat.adf. arctar00000/newlu00g/w001001.adf arctar00000/newlu00g/w001001x.adf arctar00000/newlu00g.aux Related_Spatial_and_Tabular_Data_Sets: The data set is provided as a GeoTIFF image (newlu00g.tif is contained in newlu00g.tar.gz) as well as native ArcInfo Workstation GRID format (newlu00g.tgz). The GeoTIFF file is provided as a nonproprietary format in case the user's software cannot access the data in ArcInfo Workstation GRID format. The uncompressed GeoTIFF file size is 1348131109 bytes. The following table describes the index values stored in an embedded color map in the GeoTIFF image: Index RGB Values Value R G B ----------------------------------------------------------------- 0 no data 10 255 20 147 11 255 0 255 12 255 0 0 13 208 32 144 14 255 105 180 15 255 192 203 16 238 130 238 17 255 228 225 21 255 215 0 22 255 255 0 23 255 140 0 24 238 221 130 31 255 250 205 32 244 164 96 33 218 165 32 41 152 251 152 42 0 255 0 43 124 252 0 51 135 206 250 52 0 191 255 53 0 255 255 54. 175 238 238 61 127 255 212 62 72 209 204 71 233 150 122 72 184 134 11 73 210 180 140 74 165 42 42 75 188 143 143 76 139 69 19 77 143 188 143 81 218 112 214 82 123 104 238 83 138 43 226 84 0 0 205 85 160 32 240 91 211 211 211 92 105 105 105 The newlu00g.aux (auxiliary) file archived with the .tif file stores coordinate system information for the .tif file and is recognized by ArcGIS. The newlu00g.clr (colormap) file specifies the colors to be used for displaying ArcInfo Workstation grid cell values. This is an ascii file containing the index numbers 0-255 followed by RGB values: Index -- RGB Values --- Value red green blue (LULC code) ---------------------------- # value red green blue 0 30 30 30 1 30 30 30 2 30 30 30 3 30 30 30 4 30 30 30 5 30 30 30 6 30 30 30 7 30 30 30 8 30 30 30 9 30 30 30 10 255 20 147 11 255 0 255 12 255 0 0 13 208 32 144 14 255 105 180 15 255 192 203 16 238 130 238 17 255 228 225 18 30 30 30 19 30 30 30 20 30 30 30 21 255 215 0 22 255 255 0 23 255 140 0 24 238 221. 130 25 30 30 30 26 30 30 30 27 30 30 30 28 30 30 30 29 30 30 30 30 30 30 30 31 255 250 205 32 244 164 96 33 218 165 32 34 30 30 30 35 30 30 30 36 30 30 30 37 30 30 30 38 30 30 30 39 30 30 30 40 30 30 30 41 152 251 152 42 0 255 0 43 124 252 0 44 30 30 30 45 30 30 30 46 30 30 30 47 30 30 30 48 30 30 30 49 30 30 30 50 30 30 30 51 135 206 250 52 0 191 255 53 0 255 255 54 175 238 238 55 30 30 30 56 30 30 30 57 30 30 30 58 30 30 30 59 30 30 30 60 30 30 30 61 127 255 212 62 72 209 204 63 30 30 30 64 30. 30 30 65 30 30 30 66 30 30 30 67 30 30 30 68 30 30 30 69 30 30 30 70 30 30 30 71 233 150 122 72 184 134 11 73 210 180 140 74 165 42 42 75 188 143 143 76 139 69 19 77 143 188 143 78 30 30 30 79 30 30 30 80 30 30 30 81 218 112 214 82 123 104 238 83 138 43 226 84 0 0 205 85 160 32 240 86 30 30 30 87 30 30 30 88 30 30 30 89 30 30 30 90 30 30 30 91 211 211 211 92 105 105 105 93 30 30 30 94 30 30 30 95 30 30 30 96 30 30 30 97 30 30 30 98 30 30 30 99 30 30 30 100 30 30 30 101 30 30 30 102 30 30 30 103. 30 30 30 104 30 30 30 105 30 30 30 106 30 30 30 107 30 30 30 108 30 30 30 109 30 30 30 110 30 30 30 111 30 30 30 112 30 30 30 113 30 30 30 114 30 30 30 115 30 30 30 116 30 30 30 117 30 30 30 118 30 30 30 119 30 30 30 120 30 30 30 121 30 30 30 122 30 30 30 123 30 30 30 124 30 30 30 125 30 30 30 126 30 30 30 127 30 30 30 128 30 30 30 129 30 30 30 130 30 30 30 131 30 30 30 132 30 30 30 133 30 30 30 134 30 30 30 135 30 30 30 136 30 30 30 137 30 30 30 138 30 30 30 139 30 30 30 140 30 30 30 141 30 30. 30 142 30 30 30 143 30 30 30 144 30 30 30 145 30 30 30 146 30 30 30 147 30 30 30 148 30 30 30 149 30 30 30 150 30 30 30 151 30 30 30 152 30 30 30 153 30 30 30 154 30 30 30 155 30 30 30 156 30 30 30 157 30 30 30 158 30 30 30 159 30 30 30 160 30 30 30 161 30 30 30 162 30 30 30 163 30 30 30 164 30 30 30 165 30 30 30 166 30 30 30 167 30 30 30 168 30 30 30 169 30 30 30 170 30 30 30 171 30 30 30 172 30 30 30 173 30 30 30 174 30 30 30 175 30 30 30 176 30 30 30 177 30 30 30 178 30 30 30 179 30 30 30 180. 30 30 30 181 30 30 30 182 30 30 30 183 30 30 30 184 30 30 30 185 30 30 30 186 30 30 30 187 30 30 30 188 30 30 30 189 30 30 30 190 30 30 30 191 30 30 30 192 30 30 30 193 30 30 30 194 30 30 30 195 30 30 30 196 30 30 30 197 30 30 30 198 30 30 30 199 30 30 30 200 30 30 30 201 30 30 30 202 30 30 30 203 30 30 30 204 30 30 30 205 30 30 30 206 30 30 30 207 30 30 30 208 30 30 30 209 30 30 30 210 30 30 30 211 30 30 30 212 30 30 30 213 30 30 30 214 30 30 30 215 30 30 30 216 30 30 30 217 30 30 30 218 30 30. 30 219 30 30 30 220 30 30 30 221 30 30 30 222 30 30 30 223 30 30 30 224 30 30 30 225 30 30 30 226 30 30 30 227 30 30 30 228 30 30 30 229 30 30 30 230 30 30 30 231 30 30 30 232 30 30 30 233 30 30 30 234 30 30 30 235 30 30 30 236 30 30 30 237 30 30 30 238 30 30 30 239 30 30 30 240 30 30 30 241 30 30 30 242 30 30 30 243 30 30 30 244 30 30 30 245 30 30 30 246 30 30 30 247 30 30 30 248 30 30 30 249 30 30 30 250 30 30 30 251 30 30 30 252 30 30 30 253 30 30 30 254 30 30 30 255 30 30 30. -------------------------------------------------------------- Although this Federal Geographic Data Committee-compliant metadata file is intended to document the data set in nonproprietary form, as well as in ArcInfo format, this metadata file may include some ArcInfo-specific terminology. Use of trade names in this report is for identification purposes only and does not constitute endorsement by the U.S. Geological Survey. |
Attribute information
|
OBJECTID
From Esri |
Description
Internal feature number. DomainSequential unique whole numbers that are automatically generated. |
|
Shape
From Esri |
Description
Feature geometry. DomainCoordinates defining the features. |
|
Shape_Length
From Esri |
Description
Length of feature in internal units. DomainPositive real numbers that are automatically generated. |
|
Shape_Area
From Esri |
Description
Area of feature in internal units squared. DomainPositive real numbers that are automatically generated. |
|
MosaicID
No Source Noted |
Description
Not Found DomainNot Found |
Contact information
| Maintained by | KCGIS Center |
| Primary |
KCGIS Center
giscenter@kingcounty.gov |
Terms of Use
| License | Terms of use and copyright |
Summary
This is one of the ancillary GIS (geographic information system) data layers developed to characterize USGS National Water-Quality Assessment (NAWQA) sampling sites and study areas for national synthesis of water-quality data.
For background on the design of the NAWQA program see Gilliom and others (1995).
Description
This data set represents U.S. Geological Survey (USGS) historical Land Use and Land Cover (LULC) from the 1970's that has been refined with 2000 population density at the block group level to indicate new residential development representative of the early 2000's.
Any area having a population density of at least 1,000 people per square mile had been re-classified as "urban" land in this data set.
Contact information
| Maintained by | KCGIS Center |
| Primary |
KCGIS Center
giscenter@kingcounty.gov |
Terms of use and copyright
| License | Terms of use and copyright |
Change history
| 3/14/2005 |
The grid was converted to a GeoTIFF image for distribution using the following ArcInfo Workstation command: gridimage newlu00g newlu00g.clr newlu00g tiff |
| 1/28/2003 |
The 30-m ArcInfo Workstation grid of the enhanced LULC data set (girasg) was refined using the 100-m resolution ArcInfo Workstation grid of 2000 Census block group population density using the methods described in Hitt (1994). Any area having a 2000 population density of at least 1,000 people per square mile (coded as 3,860 people per square km in the 100-m population density grid) that was not coded as urban or water in the LULC input data, was re-coded as "new residential" land use in the output data set. A numeric land use code of "10" was assigned to the "new residential" areas. This was accomplished using the following ArcInfo Workstation GRID commands: NEWLU00G = con ( ( girasg ge 11 and girasg le 17 ) or ( girasg ge 51 and girasg le 54 ) or ( girasg eq 0 ), girasg, con(uspopd00x10g ge 3860,10,girasg) ) The resulting grid has 38 categorical values: 37 corresponding to the original Anderson level 2 land use land cover categories plus 1 for the "new residential" category. Because the quality of the output data is no better than the coarsest resolution of the input data (100 meters), the resolution of the output grid was set to 100 meters even though the resolution of the input LULC data grid was 30 meters. The ArcGIS software automatically resamples unequal input cell sizes to the output cell size. |
| 1/1/2003 |
The ArcInfo Workstation seamless polygon coverage of enhaned LULC data was converted to a 30-m resolution ArcInfo Workstation grid (a raster data set in which each grid cell is 30-m by 30-m). |
| 1/1/2000 |
During the early 1990's, USGS and the Environmental Protection Agency (USEPA) converted USGS LULC maps from GIRAS format to ArcInfo Workstation coverages. USEPA disseminated the ArcInfo Workstation coverages of LULC quads as ArcInfo export files (USEPA, 1994). During the mid- to late 1990's, the USGS NAWQA program downloaded coverages of LULC quads from USEPA and corrected many minor errors in the quads. NAWQA used this corrected set of quads for water-quality applications during the mid-1990's. However, many coding and topological errors still remained in the NAWQA version of the LULC coverages. During 2002-2003, NAWQA developed an enhanced LULC data set that was more accurate, topologically clean, and seamless. (For example, land use attribute errors were fixed and quad boundaries were matched.) Price and others (2003) describe the GIS processing steps to create the enhanced LULC data set. The enhanced version of LULC is the "best available" version of the historical USGS LULC data set. |