
GIS Data Catalog
2007 King County (Pictometry) Orthoimagery - 6 in (west) and 1 ft (east)
Learn how to get an ArcGIS Online account 🗺
Use this Data
|
Links
How to use in ArcGIS Pro |
|
| Sharing Status | Not Public |
Summary
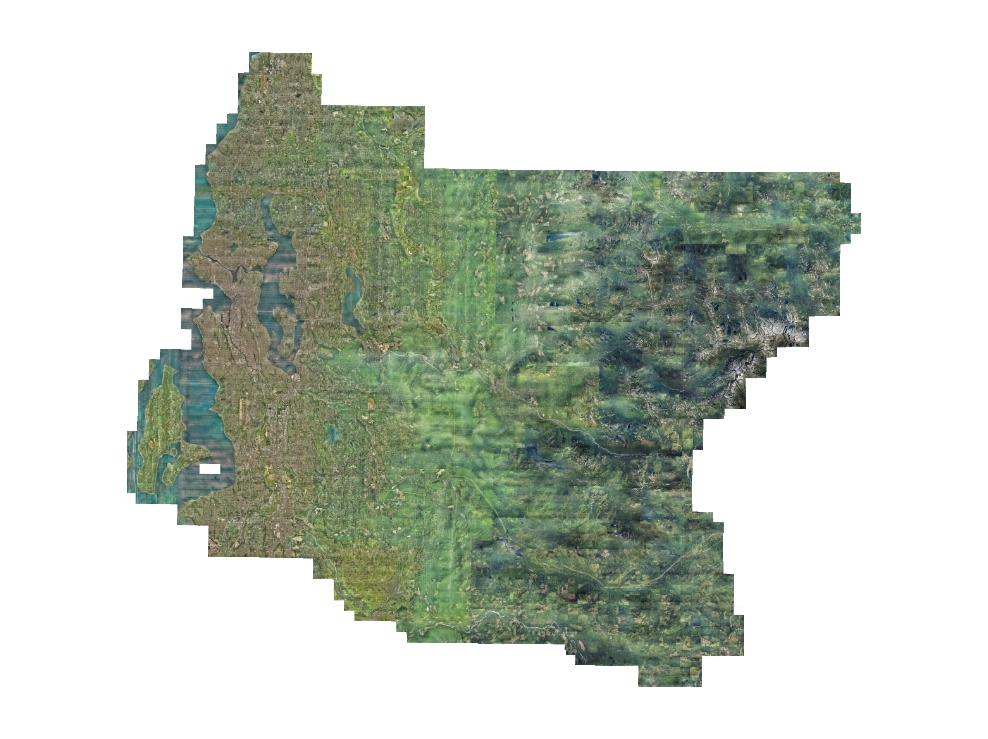
Color orthophoto imagery for King County and portions of adjoining counties.
Portion of larger Pictometry package that contains their proprietary oblique and orthogonal view imagery for the same project area.
Description
Final version 2007 (July) King County Natural Color orthoimagery acquired by Pictometry for internal business and agency use only.
Pixel resolution is 1.0 foot GSD in rural (east) King County and 0.5 foot GSD in urbanized (west) King County.
Higher resolution data includes portion of southwestern Snohomish County, the Highway 2 corridor in northeast King County and the Apenal area near Snoqualmie Pass.
The 1.0 foot data is also known as Neighborhood-level imagery whereas the 0.5 foot data is known as Community-level imagery.
Layer information
| Layer Name | IMAGE_Ortho2007KCNAT |
| Subject Category | Imagery |
| Title | 2007 King County (Pictometry) Orthoimagery - 6 in (west) and 1 ft (east) |
| Feature Count | 1 |
| Feature Type | Raster |
| Next Update | None planned |
| Spatial reference | EPSG:102748 |
| Control ID | None |
| Place Keywords | Southwestern Snohomish County, Washington State, United States, Pacific NW, King County; WA |
| Theme Keywords | Imagerybasemapsearthcover, Orthoimagery, Orthophotography |
| Supplemental Information |
The orthoimagery described in this metadata will be delivered in King Countys standard township-range tiling scheme and can be viewed with existing GIS and image viewing software. The proprietary package of oblique/orthogonal imagery from Pictometry is viewable only through their ArcGIS 9.x extension and their stand-alone EFS software. Though the imagery is stored in native resolution (both 0.5 foot and 1.0 foot) in Plibrary3, ArcGIS LYR files are standardized to a naming convention of txxryy_07n050.lyr, even for areas where the GSD of the native imagery is 1 foot. |
Attribute information
|
OBJECTID
From Esri |
Description
Internal feature number. DomainSequential unique whole numbers that are automatically generated. |
|
Shape
From Esri |
Description
Feature geometry. DomainCoordinates defining the features. |
|
Shape_Length
From Esri |
Description
Length of feature in internal units. DomainPositive real numbers that are automatically generated. |
|
Shape_Area
From Esri |
Description
Area of feature in internal units squared. DomainPositive real numbers that are automatically generated. |
|
MosaicID
No Source Noted |
Description
Not Found DomainNot Found |
Contact information
| Maintained by | KCGIS Center |
| Primary |
KCGIS Center
giscenter@kingcounty.gov |
Terms of Use
| License | Terms of use and copyright |
Use this Data
|
Links
How to use in ArcGIS Pro |
|
| Sharing Status | Not Public |
Summary
Color orthophoto imagery for King County and portions of adjoining counties.
Portion of larger Pictometry package that contains their proprietary oblique and orthogonal view imagery for the same project area.
Description
Final version 2007 (July) King County Natural Color orthoimagery acquired by Pictometry for internal business and agency use only.
Pixel resolution is 1.0 foot GSD in rural (east) King County and 0.5 foot GSD in urbanized (west) King County.
Higher resolution data includes portion of southwestern Snohomish County, the Highway 2 corridor in northeast King County and the Apenal area near Snoqualmie Pass.
The 1.0 foot data is also known as Neighborhood-level imagery whereas the 0.5 foot data is known as Community-level imagery.
Contact information
| Maintained by | KCGIS Center |
| Primary |
KCGIS Center
giscenter@kingcounty.gov |
Terms of use and copyright
| License | Terms of use and copyright |
Change history
| 7/15/2009 |
Originally, where a 7500 tile was split by the 6 inch-12 inch resolution boundary, two tiles were created, one for that portion at 6 inch resolution (tileabb_07n050.sid) and one for that portion at 12 inch resolution (tileabb_07n100.sid). Because each tile is a complete tile, using 'white' pixels (255,255,255) for those portions of the tile without imagery, it made it difficult to display two partial tiles side by side as the 'white' pixels from one resolution tile would mask the valid imagery from the other resolution tile. These tiles with duplicate tile abbreviations (tileabb) where removed from the Spatial Data Warehouse and a single tile was created (using MrSid v7, lossless) merging both resolutions. This results in a single useable tile of imagery for these split areas, although the change from 6 inch resolution to 12 inch resolution areas is often abrupt due both to the change in resolution and the fact that the two resolution areas were captured on different flights lines at different times. The merged tiles created vary in how much 6 inch resolution imagery vs 12 inch resolution imagery they contain; some contain only a very small portion of one or other of the resolutions. However, for consistency, all merged tiles are stored as tileabb_07n050.sid. With this Process Step, there is now only one image tile for each 7500 tiling block within the project area. |
| 7/1/2008 |
After determining that the sector source data would be the only deliverable available for final orthos, these data were used to build the base 7500 tiles for the database. Normally, the township tiles (created in the previous step) do not get created until the 7500 tiles exist. However, in this case, both the township tiles and the 7500 tiles were created directly from the sector tile TIFF data using MrSid V7 software. The only difference between the 7500 tiles and the Township tiles is that the 7500 tiles are SID format compressed losslessly while the township tiles are SID format at 15x compression. Even though the difference in quality and resolution between the 7500 tiles and township tiles is almost negligable, the 7500 tiles should represent a more true representation of the original TIFF image quality and resolution. Having the 7500 tiles also provides a smaller file (200 mb vs 900 mb) than the township tile when only a smaller area is required. Finally, the 7500 sid tiles can be successfully converted to TIFF using the GP Copy Raster tool. |
| 7/1/2008 |
Township-Range tiles in SID format were recreated using MrSid V7. This allowed the tiles to be clipped to orthogonal township-range minimum bounding rectangles so that there are no null sectors along edges. Both ArcGIS and ArcView 3x users can load the sid files (or LYR Files for ArcGIS users) without any additional symbolization required to minimize edge effects. Because the extent of the tiles was reduced by this revision, the compression ratio was reduced from 20x to 15x improving the quality of the output tiles. |
| 5/1/2008 |
Image data was imported into separate SDE raster feature dataset mosaics (GISPROD.Raster). REG_07NAT_050 contains the portion of the project at 0.5 foot (6 inch) resolution and REG_07NAT_100 contains the portion of the project at 1.0 foot resolution. Import parameters include jp2000 compression at 75% quality. Mosaics were pyramided upon completion of import using jp2000 compression. Details for each mosaic: ArcSDE 9.2 for SQL Server Build 1206 Fri Oct 19 08:31:29 2007 Raster ID ...................: 1 Raster Dimension ............: 200382+63, 265004, 3 Raster Tile Dimension .......: 256, 256 Pixel Type ..................: uchar Compression .................: jp2 Image Pyramid ...............: 9, false, nearest Extent ......................: minx : 1390764.00000000000000 miny : 26143.00000000000000 maxx : 1591145.00000000000000 maxy : 291146.00000000000000 Cell Size....................: x : 1.00000000000000 y : 1.00000000000000 Statistics ..................: <NONE> Raster Layer Description ....: Raster Column Table Name ..................: RASTER.ORTHO.KC2007_NAT_100 Raster Column ...............: RASTER Raster Layer ID .............: 40 Minimum Raster ID ...........: 1 Creation Date ...............: Thu Apr 03 09:58:50 2008 User Privileges .............: SELECT, INSERT, DELETE, UPDATE Raster Layer Configuration ..: DEFAULTS Storage Type ................: DEFAULT Coordinate System ...........: PROJCS["NAD_1983_HARN_StatePlane_Washington_North_FIPS_4601_Feet",GEOGCS["GCS_North_American_1983_HARN",DATUM["D_North_American_1983_HARN",SPHEROID["GRS_1980",6378137.0,298.257222101]],PRIMEM["Greenwich",0.0],UNIT["Degree",0.0174532925199433]],PROJECTION["Lambert_Conformal_Conic"],PARAMETER["False_Easting",1640416.666666667],PARAMETER["False_Northing",0.0],PARAMETER["Central_Meridian",-120.8333333333333],PARAMETER["Standard_Parallel_1",47.5],PARAMETER["Standard_Parallel_2",48.73333333333333],PARAMETER["Latitude_Of_Origin",47.0],UNIT["Foot_US",0.3048006096012192]] ArcSDE 9.2 for SQL Server Build 1206 Fri Oct 19 08:31:29 2007 Raster ID ...................: 1 Raster Dimension ............: 700406+126, 605597, 3 Raster Tile Dimension .......: 256, 256 Pixel Type ..................: uchar Compression .................: jp2 Image Pyramid ...............: 9, false, nearest Extent ......................: minx : 1214233.00000000000000 miny : 48456.00000000000000 maxx : 1564435.50000000000000 maxy : 351254.00000000000000 Cell Size....................: x : 0.50000000000000 y : 0.50000000000000 Statistics ..................: <NONE> Raster Layer Description ....: Raster Column Table Name ..................: RASTER.ORTHO.KC2007_NAT_050 Raster Column ...............: RASTER Raster Layer ID .............: 36 Minimum Raster ID ...........: 1 Creation Date ...............: Wed Apr 02 09:45:41 2008 User Privileges .............: SELECT, INSERT, DELETE, UPDATE Raster Layer Configuration ..: DEFAULTS Storage Type ................: DEFAULT Coordinate System ...........: PROJCS["NAD_1983_HARN_StatePlane_Washington_North_FIPS_4601_Feet",GEOGCS["GCS_North_American_1983_HARN",DATUM["D_North_American_1983_HARN",SPHEROID["GRS_1980",6378137.0,298.257222101]],PRIMEM["Greenwich",0.0],UNIT["Degree",0.0174532925199433]],PROJECTION["Lambert_Conformal_Conic"],PARAMETER["False_Easting",1640416.666666667],PARAMETER["False_Northing",0.0],PARAMETER["Central_Meridian",-120.8333333333333],PARAMETER["Standard_Parallel_1",47.5],PARAMETER["Standard_Parallel_2",48.73333333333333],PARAMETER["Latitude_Of_Origin",47.0],UNIT["Foot_US",0.3048006096012192]]. |
| 5/1/2008 |
Multiple attempts were made to create a full project area (KEYREGION) mosaic from the imagery. Even at 2.0 foot resolution a single mosaic was not successful. Rather a west county mosaic (REG_07N050.sid) and an east county mosaic (REG_07N100.sid) were created. Keeping with general practice the last three integer values of the name reflect the GSD (ground sample distance) of the initial image resolution, not the resolution of the final mosaic. KEYREGION components are intended to represent a lower-resolution, large extent, version of the data set. In this case the west county mosaic approximates the extent of the original 0.5 foot resolution data and the east county mosaic approximates the extent of the original 1.0 foot resolution data. MrSid V5 was used to create the mosaics (level 3) using 50X compression. |
| 5/1/2008 |
All original Pictometry sector tile data (the data used to create the draft orthos and all subsequent mosaics) was copied to Plibrary3 idxp7500 ORTHO_2007KC07_NAT folder. Even though these tiles are not in the King County standard scheme, they were placed here to serve as full-resolution source data archive. |
| 5/1/2008 |
All 1.0 foot resampled imagery was resampled to 2.0 foot pixel resolution for use in creation of higher-level mosaics. This resolution was adopted after tests of creating required mosaics at 1.0 foot and 1.5 foot resolutions were not successful. Resampling was performed using NEAREST NEIGHBOR. The original 1.0 foot resolution data has a TFW world file as originally supplied by Pictometry. However all the imagery was resampled using ArcToolBox GP tools which produce a world file without a TFW. |
| 5/1/2008 |
All 0.5 foot resolution image tiles were resampled to 1.0 foot pixel using NEAREST NEIGHBOR. These were combined with the existing 1.0 foot resolution data to complete a full set of 1.0 foot resolution data for possible submission to the USGS for use in the National Map program. The original 1.0 foot resolution data has a TFW world file as originally supplied by Pictometry. However the imagery resampled from the 0.5 foot imagery used ArcTools GP tools that produced a GEOTIFF which do not have world files. |
| 5/1/2008 |
King County Zone Tile mosaics were created from 2.0 foot resampled imagery. MrSid V5 software was used to create the level 3 mosaics with a compression ratio of 20x. |
| 2/1/2008 |
Data acquired from Pictometry on a stand-alone server connected to the King County LAN. |
| 2/1/2008 |
The imagery was in Pictometry sector tiling scheme. This data was not reclipped to King Countys standard 7500 tiling scheme. Instead, MrSid v6 project files were created from all sector tiles (approximately 0.5 x 0.5 miles square) that fall whole ar part into the township tile. These tiles were mosaicked into a single sid file at 20x compression. Because of the rotation inherent in the sector pieces, introduced during reprojection by Pictometry, the edges of the mosaics are not orthogonal and thus tile edges show black (0,0,0) masks. |