
GIS Data Catalog
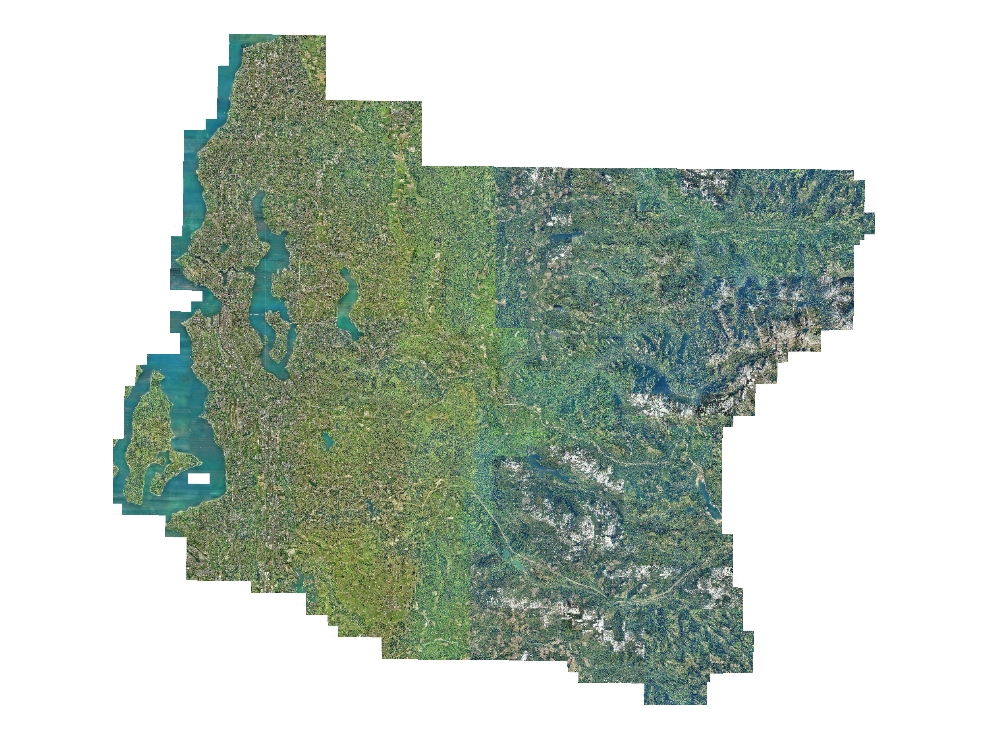
2009 King County (Pictometry) Orthoimagery - 6 in (west) and 1 ft (east)
Learn how to get an ArcGIS Online account 🗺
Use this Data
|
Links
How to use in ArcGIS Pro |
|
| Sharing Status | Not Public |
Summary
Color orthophoto imagery for King County and portions of adjoining counties.
Portion of larger Pictometry package that contains their proprietary oblique and orthogonal view imagery for the same project area.
Description
Final version 2009 King County Natural Color orthoimagery acquired by Pictometry for internal business and agency use only.
Pixel resolution is 1.0 foot GSD in rural (east) King County and 0.5 foot GSD in urbanized (west) King County.
Higher resolution data includes portion of southwestern Snohomish County, the Highway 2 corridor in northeast King County and the Apenal area near Snoqualmie Pass.
The 1.0 foot data is also known as Neighborhood-level imagery whereas the 0.5 foot data is known as Community-level imagery.
Layer information
| Layer Name | IMAGE_Ortho2009KCNAT |
| Subject Category | Imagery |
| Title | 2009 King County (Pictometry) Orthoimagery - 6 in (west) and 1 ft (east) |
| Feature Count | 1 |
| Feature Type | Raster |
| Next Update | None planned |
| Spatial reference | EPSG:102748 |
| Control ID | None |
| Place Keywords | Southwestern Snohomish County, Washington State, United States, Pacific NW, King County; WA |
| Theme Keywords | Imagerybasemapsearthcover, Orthoimagery, Orthophotography |
| Supplemental Information |
The orthoimagery described in this metadata will be delivered in King Countys standard township-range tiling scheme and can be viewed with existing GIS and image viewing software. The proprietary package of oblique/vertical imagery from Pictometry is viewable only through their ArcGIS 9.x extension and their stand-alone EFS software. Though the imagery is stored in native resolution (both 0.5 foot and 1.0 foot) in Plibrary3, ArcGIS LYR files are standardized to a naming convention of txxryy_07n050.lyr, even for areas where the GSD of the native imagery is 1 foot. Orthoimage tiles are composites of individual images and have undergone reprocessing. As such the date stamp on the sector tiles or their derivatives is not correct. To correctly determine the acquistion date and time for an area you need to use the spatial indexes found in plibrary3/reference/indexes/Pictometry09. ortho_image.shp for the every image resolved to YYYY/MM/DD HH:MM:SS ortho_dategrp.shp for images grouped (dissolved by YYYYMMDD) |
Attribute information
|
OBJECTID
From Esri |
Description
Internal feature number. DomainSequential unique whole numbers that are automatically generated. |
|
Shape
From Esri |
Description
Feature geometry. DomainCoordinates defining the features. |
|
Shape_Length
From Esri |
Description
Length of feature in internal units. DomainPositive real numbers that are automatically generated. |
|
Shape_Area
From Esri |
Description
Area of feature in internal units squared. DomainPositive real numbers that are automatically generated. |
|
MosaicID
No Source Noted |
Description
Not Found DomainNot Found |
Contact information
| Maintained by | KCGIS Center |
| Primary |
KCGIS Center
giscenter@kingcounty.gov |
Terms of Use
| License | Terms of use and copyright |
Use this Data
|
Links
How to use in ArcGIS Pro |
|
| Sharing Status | Not Public |
Summary
Color orthophoto imagery for King County and portions of adjoining counties.
Portion of larger Pictometry package that contains their proprietary oblique and orthogonal view imagery for the same project area.
Description
Final version 2009 King County Natural Color orthoimagery acquired by Pictometry for internal business and agency use only.
Pixel resolution is 1.0 foot GSD in rural (east) King County and 0.5 foot GSD in urbanized (west) King County.
Higher resolution data includes portion of southwestern Snohomish County, the Highway 2 corridor in northeast King County and the Apenal area near Snoqualmie Pass.
The 1.0 foot data is also known as Neighborhood-level imagery whereas the 0.5 foot data is known as Community-level imagery.
Contact information
| Maintained by | KCGIS Center |
| Primary |
KCGIS Center
giscenter@kingcounty.gov |
Terms of use and copyright
| License | Terms of use and copyright |
Change history
| 11/1/2009 |
Data acquired from Pictometry on a stand-alone server connected to the King County LAN. |
| 11/1/2009 |
Image data was imported into separate SDE raster feature dataset mosaics (GISPROD.Raster). REG_09NAT_050 contains the portion of the project at 0.5 foot (6 inch) resolution and REG_09NAT_100 contains the portion of the project at 1.0 foot resolution. |
| 7/1/2008 |
Both the township tiles and the 7500 tiles were created directly from the sector tile TIFF data using MrSid V7 software. The only difference between the 7500 tiles and the Township tiles is that the 7500 tiles are SID format compressed losslessly while the township tiles are SID format at 15x compression. Even though the difference in quality and resolution between the 7500 tiles and township tiles is almost negligable, the 7500 tiles should represent a more true representation of the original TIFF image quality and resolution. Having the 7500 tiles also provides a smaller file (200 mb vs 900 mb) than the township tile when only a smaller area is required. Finally, the 7500 sid tiles can be successfully converted to TIFF using the GP Copy Raster tool. |
| 7/1/2008 |
Township-Range tiles in SID format were created using MrSid V7 at 15x compression. |
| 5/1/2008 |
A west county mosaic (REG_07N050.sid) and an east county mosaic (REG_07N100.sid) were created. Keeping with general practice the last three integer values of the name reflect the GSD (ground sample distance) of the initial image resolution, not the resolution of the final mosaic. KEYREGION components are intended to represent a lower-resolution, large extent, version of the data set. In this case the west county mosaic approximates the extent of the original 0.5 foot resolution data and the east county mosaic approximates the extent of the original 1.0 foot resolution data. MrSid V7 was used to create the mosaics (level 3) using 50X compression. |
| 5/1/2008 |
King County Zone Tile mosaics were created from 2.0 foot resampled imagery. MrSid V5 software was used to create the level 3 mosaics with a compression ratio of 20x. |
| Update 7 |
All 7500 SID tiles were inspected for QC. Snow and Smears were identified, digitized, and coded. The snow and smears were then unioned with Pictometry's index to identify which Pictometry tile was defective: idxpsect09_errors.shp. This will be sent to Pictometry for QC inspection. |