
GIS Data Catalog
Average Monthly or Annual Maximum Temperature, 1971-2000
Learn more by reading the GIS FAQ 🗺
Summary
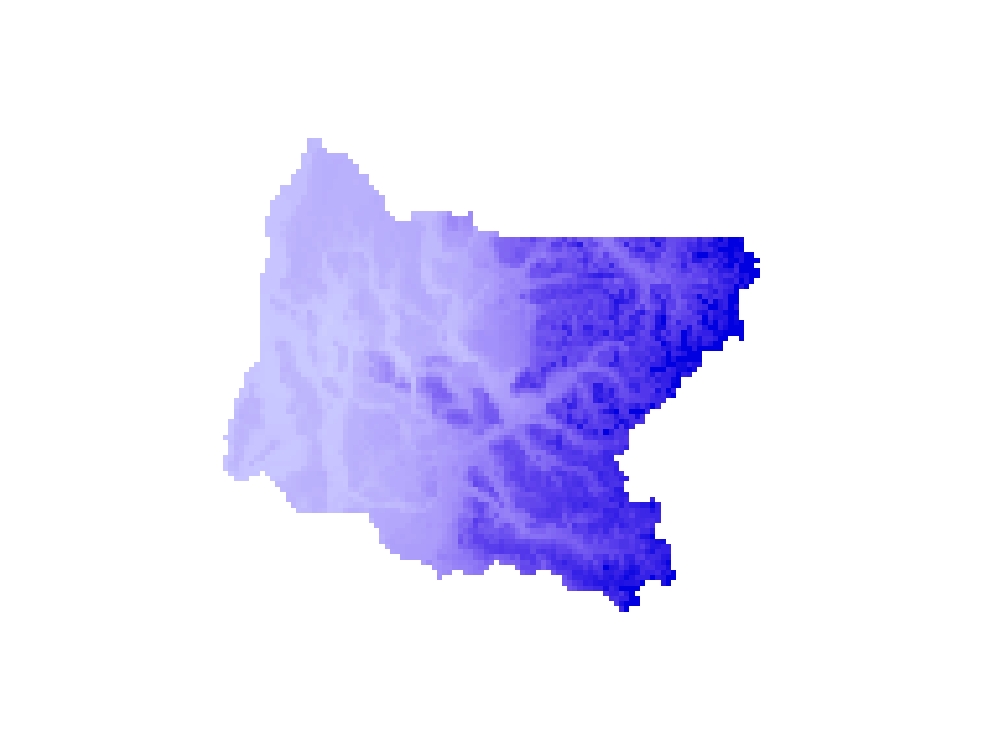
Display and/or analyses requiring spatially distributed monthly or annual maximum temperature for the climatological period 1971-2000.
Description
This data set contains spatially gridded average monthly and annual maximum temperature for the climatological period 1971-2000.
Distribution of the point measurements to a spatial grid was accomplished using the PRISM model, developed and applied by Chris Daly of the PRISM Climate Group at Oregon State University.
Layer information
| Layer Name | LANDCOVER_JanurayAverageMinimumTemperature1971_2000KC |
| Subject Category | Imagery |
| Title | Average Monthly or Annual Maximum Temperature, 1971-2000 |
| Feature Count | 1 |
| Feature Type | Raster |
| Next Update | As needed |
| Spatial reference | None |
| Control ID | None |
| Place Keywords | King County, Washington State |
| Theme Keywords | Maximum Temperature |
| Supplemental Information |
There are many methods of interpolating climate from monitoring stations to grid points. Some provide estimates of acceptable accuracy in flat terrain, but few have been able to adequately explain the extreme, complex variations in climate that occur in mountainous regions. Significant progress in this area has been achieved through the development of PRISM (Parameter-elevation Regressions on Independent Slopes Model). PRISM is an analytical model that uses point data and an underlying grid such as a digital elevation model (DEM) or a 30 yr climatological average (e.g. 1971- 2000 average) to generate gridded estimates of monthly and annual precipitation and temperature (as well as other climatic parameters). PRISM is well suited to regions with mountainous terrain, because it incorporates a conceptual framework that addresses the spatial scale and pattern of orographic processes. Grids were modeled on a monthly basis. Annual grids of temperature are produced by averaging the monthly grids, and summing for precipitation. |
Attribute information
|
OBJECTID
From Daly, C., W. P. Gibson, G.H. Taylor, G. L. Johnson, P. Pasteris. 2002. A knowledge-based approach to the statistical mapping of climate. Climate Research, 22, 99-113, 2002 |
Description
spatially gridded average maximum temperature DomainSequential unique whole numbers that are automatically generated. |
|
Shape
From Esri |
Description
Feature geometry. DomainCoordinates defining the features. |
|
Shape_Length
From Esri |
Description
Length of feature in internal units. DomainPositive real numbers that are automatically generated. |
|
Shape_Area
From Esri |
Description
Area of feature in internal units squared. DomainPositive real numbers that are automatically generated. |
|
MosaicID
No Source Noted |
Description
Not Found DomainNot Found |
Contact information
| Maintained by | KCGIS Center |
| Primary |
KCGIS Center
giscenter@kingcounty.gov |
Terms of Use
| License | Terms of use and copyright |
Summary
Display and/or analyses requiring spatially distributed monthly or annual maximum temperature for the climatological period 1971-2000.
Description
This data set contains spatially gridded average monthly and annual maximum temperature for the climatological period 1971-2000.
Distribution of the point measurements to a spatial grid was accomplished using the PRISM model, developed and applied by Chris Daly of the PRISM Climate Group at Oregon State University.
Contact information
| Maintained by | KCGIS Center |
| Primary |
KCGIS Center
giscenter@kingcounty.gov |
Terms of use and copyright
| License | Terms of use and copyright |