
GIS Data Catalog
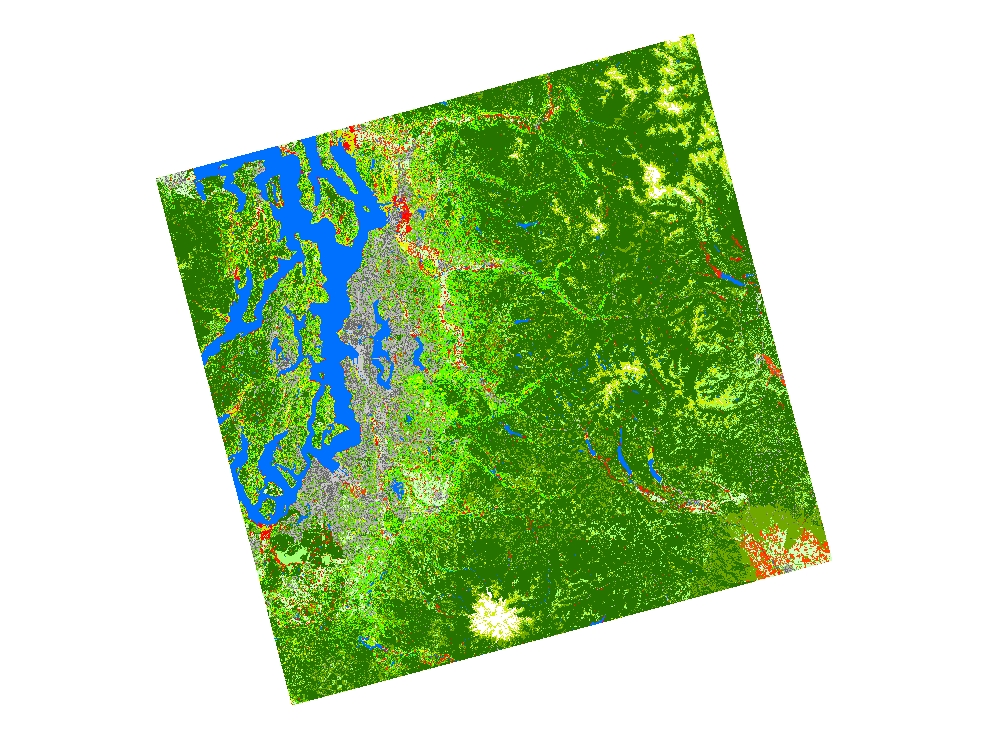
2001 National Land Cover Database Zone 01 Land Cover Layer
Learn more by reading the GIS FAQ 🗺
Summary
The goal of this project is to provide the Nation with complete, current and consistent public domain information on its land use and land cover.
Description
The National Land Cover Database 2001 land cover layer for mapping zone 01 was produced through a cooperative project conducted by the Multi-Resolution Land Characteristics (MRLC) Consortium.
The MRLC Consortium is a partnership of federal agencies (www.mrlc.gov), consisting of the U.S. Geological Survey (USGS), the National Oceanic and Atmospheric Administration (NOAA), the U.S. Environmental Protection Agency (EPA), the U.S. Department of Agriculture (USDA), the U.S. Forest Service (USFS), the National Park Service (NPS), the U.S. Fish and Wildlife Service (FWS), the Bureau of Land Management (BLM) and the USDA Natural Resources Conservation Service (NRCS).
One of the primary goals of the project is to generate a current, consistent, seamless, and accurate National Land cover Database (NLCD) circa 2001 for the United States at medium spatial resolution.
This landcover map and all documents pertaining to it are considered "provisional" until a formal accuracy assessment can be conducted.
For a detailed definition and discussion on MRLC and the NLCD 2001 products, refer to Homer et al.
(2004) and https://www.mrlc.gov/mrlc2k.asp .
The NLCD 2001 is created by partitioning the U.S. into mapping zones.
A total of 66 mapping zones were delineated within the conterminous U.S. based on ecoregion and geographical characteristics, edge matching features and the size requirement of Landsat mosaics.
Mapping zone 01 encompasses whole or portions of several states, including the state of Washington.
Questions about the NLCD mapping zone 01 can be directed to the NLCD 2001 land cover mapping team at the USGS/EROS, Sioux Falls, SD (605) 594-6151 or mrlc@usgs.gov.
Layer information
| Layer Name | LANDCOVER_NationalLandcoverDB2001LandCover |
| Subject Category | Imagery |
| Title | 2001 National Land Cover Database Zone 01 Land Cover Layer |
| Feature Count | 1 |
| Feature Type | Raster |
| Next Update | As needed |
| Spatial reference | None |
| Control ID | None |
| Place Keywords | Zone 01 |
| Theme Keywords | Imagery, Base Maps, Earth Cover, USGS, Digital Spatial Data, GIS, U.S. Geological Survey, Land Cover |
| Supplemental Information |
Corner Coordinates (center of pixel, projection meters) Upper Left Corner: -2147160.00 meters(X), 3180540.00 meters(Y) Lower Right Corner: -1736280.00 meters(X), 2777100.00 meters(Y) |
Attribute information
|
ObjectID
From ESRI |
Description
Internal feature number DomainSequential unique whole numbers that are automatically generated. |
|
Shape
From Esri |
Description
Feature geometry. DomainCoordinates defining the features. |
|
Shape_Length
From Esri |
Description
Length of feature in internal units. DomainPositive real numbers that are automatically generated. |
|
Shape_Area
From Esri |
Description
Area of feature in internal units squared. DomainPositive real numbers that are automatically generated. |
|
MosaicID
No Source Noted |
Description
Not Found DomainNot Found |
Contact information
| Maintained by | KCGIS Center |
| Primary |
KCGIS Center
giscenter@kingcounty.gov |
Terms of Use
| License | Terms of use and copyright |
Summary
The goal of this project is to provide the Nation with complete, current and consistent public domain information on its land use and land cover.
Description
The National Land Cover Database 2001 land cover layer for mapping zone 01 was produced through a cooperative project conducted by the Multi-Resolution Land Characteristics (MRLC) Consortium.
The MRLC Consortium is a partnership of federal agencies (www.mrlc.gov), consisting of the U.S. Geological Survey (USGS), the National Oceanic and Atmospheric Administration (NOAA), the U.S. Environmental Protection Agency (EPA), the U.S. Department of Agriculture (USDA), the U.S. Forest Service (USFS), the National Park Service (NPS), the U.S. Fish and Wildlife Service (FWS), the Bureau of Land Management (BLM) and the USDA Natural Resources Conservation Service (NRCS).
One of the primary goals of the project is to generate a current, consistent, seamless, and accurate National Land cover Database (NLCD) circa 2001 for the United States at medium spatial resolution.
This landcover map and all documents pertaining to it are considered "provisional" until a formal accuracy assessment can be conducted.
For a detailed definition and discussion on MRLC and the NLCD 2001 products, refer to Homer et al.
(2004) and https://www.mrlc.gov/mrlc2k.asp .
The NLCD 2001 is created by partitioning the U.S. into mapping zones.
A total of 66 mapping zones were delineated within the conterminous U.S. based on ecoregion and geographical characteristics, edge matching features and the size requirement of Landsat mosaics.
Mapping zone 01 encompasses whole or portions of several states, including the state of Washington.
Questions about the NLCD mapping zone 01 can be directed to the NLCD 2001 land cover mapping team at the USGS/EROS, Sioux Falls, SD (605) 594-6151 or mrlc@usgs.gov.
Contact information
| Maintained by | KCGIS Center |
| Primary |
KCGIS Center
giscenter@kingcounty.gov |
Terms of use and copyright
| License | Terms of use and copyright |
Change history
| unknown |
Methods used to generate the land cover dataset for zone 01 described above are similar to and compatible with methods used in other zones of the NLCD dataset. For coastal zones mapped by NOAA and/or NOAA contractors, the land cover dataset classification codes and the source dataset for classification of urban areas is different. For national consistency, an additional process step was added to cross-walk the NOAA class codes to standard NLCD 2001 class codes described in the Entity and Attribute Information section of this document. NOAA urban pixel values were replaced with values determined from the NLCD 2001 percent imperviousness mapping product. The four classes in urban and suburban areas were determined from the percent imperviousness mapping product (described in the next section). The threshold for the four classes is: (1) developed open space (imperviousness < 20%), (2) low-intensity developed (imperviousness from 20 - 49%), (3) medium intensity developed (imperviousness from 50 -79%), and (4) high-intensity developed (imperviousness > 79%). The completed single pixel product was then generalized to a 1 acre (approximately 5 ETM+ 30 m pixel patch) minimum mapping unit product using a "smart eliminate" algorithm. This aggregation program subsumes pixels from the single pixel level to a 5- pixel patch using a queens algorithm at doubling intervals. The algorithm consults a weighting matrix to guide merging of cover types by similarity, resulting in a product that preserves land cover logic as much as possible. |
| Update 2 |
This dataset was created by Space Imaging. This version of the classification is the late-date (2000-era). The study area is the Coastal Washington Region. An early-date (1995-era) classification is also available for the same area. Summary- This section outlines the classification procedure for the Oregon C-CAP. The three dates of imagery were first reviewed for image quality and shifts between image dates. Training points were used as the dependent variable in a CART (Classification Analysis by Regression Tree) approach. Ancillary data layers were calculated from the TM data and were used as additional independent variables in the analysis. Different versions of the map were produced using different combinations of independent variables. The rough map represented the output from the CART classification routine. Ancillary data were used in spatial models were applied to the rough map to produce the provisional map. This represented a fully automated product. This product was then altered by hand edits to refine the classification. In addition, a percent impervious data layer developed from TM data using high resolution imagery, was imbedded into the classification to define the developed classes. This produced the final-with-edits version which is the final version of the classification and is the one described here. Pre-processing steps- Each Landsat TM scene was geo-referenced by USGS (United States Geological Survey) EROS. The Space Imaging staff reviewed the spectral and spatial quality of the imagery. Areas that were greater than 1-2 pixels off were sent back to USGS for reprocessing. The data was geo-referenced to Albers Conical Equal Area, with a spheroid of GRS 1980, and Datum of WGS84. The data units is in meters. The Washington TM data was delivered in the form of USGS zone mosaics. The data included three dates of TM: leaf-on, leaf-off, and spring. For each date of TM, spectral and tasseled cap data were received. Acquisition dates of Landsat ETM+ (TM) scenes used for land cover classification in zone 01 are as follows: SPRING- Index 1 for Path 45/Row 26 on 03/21/01 = Scene_ID 5045026000108010 Index 2 for Path 45/Row 27 on 03/26/00 = Scene_ID 7045027000008650 Index 1 for Path 45/Row 28 on 03/21/01 = Scene_ID 5045028000108010 Index 3 for Path 46/Row 26 on 05/07/01 = Scene_ID 7046026000112750 Index 4 for Path 46/Row 27 on 05/31/01 = Scene_ID 5046027000115110 Index 5 for Path 46/Row 28 on 04/10/00 = Scene_ID 5046028000010110 Index 6 for Path 47/Row 26 on 02/13/00 = Scene_ID 5047026000004410 Index 7 for Path 47/Row 27 on 02/26/02 = Scene_ID 7047027000205750 Index 7 for Path 47/Row 28 on 02/26/02 = Scene_ID 7047028000205750 Index 8 for Path 48/Row 26 on 04/03/01 = Scene_ID 7048026000109350 Index 8 for Path 48/Row 27 on 04/03/01 = Scene_ID 7048027000109350 LEAF ON (Summer)- Index 1 for Path 45/Row 26 on 07/16/00 = Scene_ID 7045026000019850 Index 2 for Path 45/Row 27 on 07/22/02 = Scene_ID 7045027000220350 Index 1 for Path 45/Row 28 on 07/16/00 = Scene_ID 7045028000019850 Index 3 for Path 46/Row 26 on 08/11/01 = Scene_ID 7046026000122350 Index 4 for Path 46/Row 27 on 07/07/00 = Scene_ID 7046027000018950 Index 4 for Path 46/Row 28 on 07/07/00 = Scene_ID 7046028000018950 Index 5 for Path 47/Row 26 on 07/30/00 = Scene_ID 7047026000021250 Index 5 for Path 47/Row 27 on 07/30/00 = Scene_ID 7047027000021250 Index 6 for Path 47/Row 28 on 07/01/01 = Scene_ID 7047028000118250 Index 7 for Path 48/Row 26 on 07/21/00 = Scene_ID 7048026000020350 Index 8 for Path 48/Row 27 on 06/03/00 = Scene_ID 7048027000015550 LEAF-OFF (Fall)- Index 1 for Path 45/Row 26 on 10/18/99 = Scene_ID 7045026009929150 Index 2 for Path 45/Row 27 on 10/04/00 = Scene_ID 7045027000027850 Index 3 for Path 45/Row 28 on 08/17/00 = Scene_ID 7045028000023050 Index 4 for Path 46/Row 26 on 09/12/01 = Scene_ID 7046026000125550 Index 5 for Path 46/Row 27 on 09/25/00 = Scene_ID 7046027000026950 Index 5 for Path 46/Row 28 on 09/25/00 = Scene_ID 7046028000026950 Index 6 for Path 47/Row 26 on 10/05/01 = Scene_ID 7047026000127850 Index 7 for Path 47/Row 27 on 11/01/99 = Scene_ID 7047027009930550 Index 8 for Path 47/Row 28 on 10/16/99 = Scene_ID 7047028009928950 Index 9 for Path 48/Row 26 on 09/23/00 = Scene_ID 7048026000026750 Index 9 for Path 48/Row 27 on 09/23/00 = Scene_ID 7048027000026750 Field-Collected Data- The goals of the field data collection were to sample the diversity of the landscape, within the classes, and among image dates. Classes that would be more difficult to collect from air photos were targeted for field data collection. To meet these goals, Space Imaging stratified the image into spectral clusters and located the field sites throughout the study area based on these. In addition to these pre-arranged sites, Space Imaging collected points while driving between locations. Due to limited time and accessibility, not all polygons were assessed in the field. Those that we did not visit on the ground were labeled with digital orthophotographs or Emerge data if it was available. Both training and validation points were collected together. See the accuracy assessment section to see how the points were split into training and validation points. Space Imaging used laptop computers and GPS (Global Positioning System)to correctly locate field points on the TM imagery. Software downloaded from the Minnesota's Department of Natural Resources (DNR)was used to connect the Garmin GPS to the laptop (https://www.dnr.state.mn.us/mis/gis/tools/arcview/extensions/DNRGarmin/DNRGarmin.html) computer and ESRI's ArcView software. Space Imaging's programmer developed an ArcView application that allowed entry of location and field notes with a click of the mouse. These data were stored in a shape file. The items that were collected were- Land Cover characterization Special conditions and remarks Photograph Number Date/time X,Y location The data and equipment used for the fieldwork are as follows- Ancillary datasets- TIGER 2000 NLCD NWI - mosaicked into zones State road map and Delorme state atlas www.delorme.com Hardware- Lap-tops with ArcView and data GARMIN GPS modules and external antennae, redundant data cables Cameras Backup devices (Floppy Drives) Extra batteries (lap-top and GPS) Mobile phones System backup CD's with data and software Compass Binoculars Field notebooks with instructions and road maps with pre-determined routes Wetland and Vegetation Field Guides Imagery- Multi-spectral data for each zone Initial classifications Classification- After the field points for training were collected, they were combined with photo-interpreted points and used as the dependent variable in a CART classification approach. Many layers tested as independent layers. They included three dates of spectral and tasseled cap imagery, DEM, slope, aspect, texture, band indices (NDVI, Moisture, NDVI-Green), shape indices fractal dimension, compactness, convexity, and form), Census data (housing and population density). Statistical analyses and visual inspection of the output was used to eliminate data that was redundant or not useful in the classification. Additional training points were added to help reduce some of the confusion between classes. The rough classification was created at the end of this process using only the CART discrete decision-tree software. A provisional classification was produced by applying spatial models using ancillary data to the rough classification. The provisional map was then edited using hand editing techniques while using high resolution imagery as reference data. Independently, of this process, Space Imaging produced percent impervious data layers for Washington. This layer was developed from Regression Tree and used impervious classifications from IKONOS imagery to predict pixel level percent impervious at the TM pixel level. The continuous percent impervious data was thresholded to produce the developed categories and imbedded into the final map. Attributes for this product are as follows- 0 Background 1 Unclassified (Cloud, Shadow, etc) 2 High Intensity Developed 3 Low Intensity Developed 4 Cultivated Land 5 Grassland 6 Deciduous Forest 7 Evergreen Forest 8 Mixed Forest 9 Scrub/Shrub 10 Palustrine Forested Wetland 11 Palustrine Scrub/Shrub Wetland 12 Palustrine Emergent Wetland 13 Estuarine Forested Wetland 14 Estuarine Scrub/Shrub Wetland 15 Estuarine Emergent Wetland 16 Unconsolidated Shore 17 Bare Land 18 Water 19 Palustrine Aquatic Bed 20 Estuarine Aquatic Bed 21 Tundra 22 Snow/Ice Ancillary Datasets- Non-TM image datasets used are DEM (Digital Elevation Model), slope, aspect, positional index, NWI, NLCD, TIGER2000, field-collected points, photo-interpreted points, Washington (Gap Analysis Program), Census data (housing and population density), Ecoregions, IVMP (Interagency Vegetation Mapping Program), Washington Coastal Atlas, Washington ShoreZone Inventory Data. QA/QC Process- There were several QA/QC steps involved in the creation of this product. First, there was an internal QA/QC. This was done by viewing the classification frame- by-frame along with the TM imagery, the classification, and high resolution reference imagery. NOAA staff completed a similar review and provided both general and point comments. Post-Processing Steps- Both Washington and Oregon zones were classified concurrently but independently. When they were completed, they were edgematched to each other. |