
GIS Data Catalog
2003 LiDAR Digital Ground Model Point Density
Learn more by reading the GIS FAQ 🗺
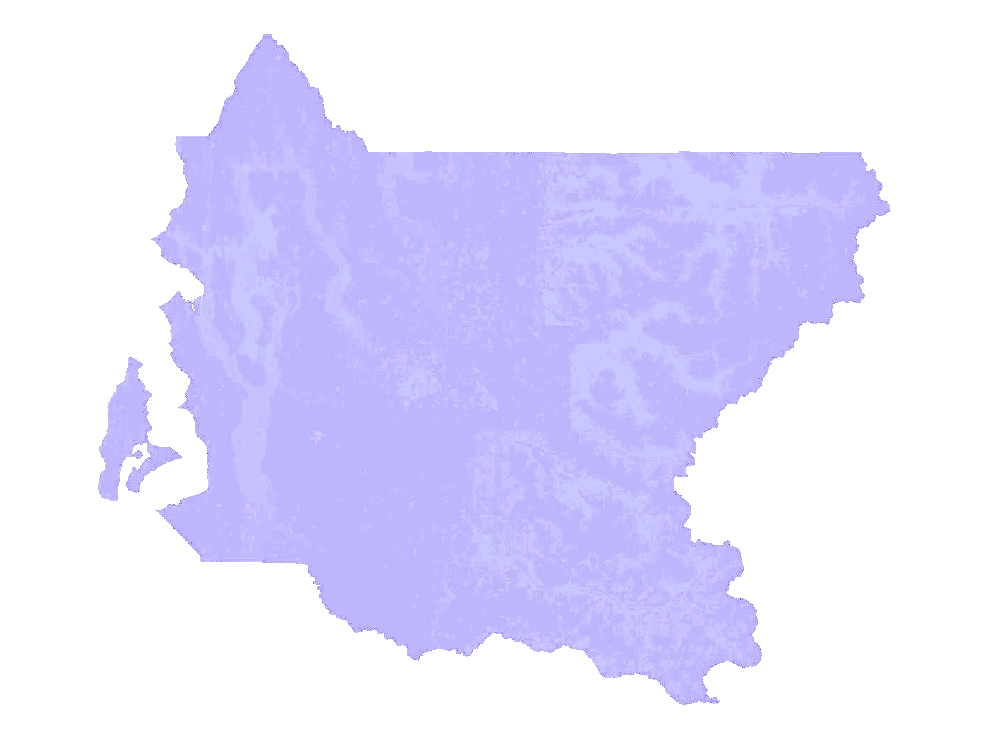
Summary
Serves as a guide to the amount of elevation control that was provided by the randomly-spaced elevation sample points.
Production elevation models are provided as interpolated lattices based on a standard posting distance.
These models do not provide information about the initial data point density used to derive the model.
The density data can be use to inform the user as to the amount of LiDAR control in a given area, where data voids occur, and some general information about vegetation canopy density.
Detailed investigations regarding LiDAR penetration rates and more accurate point density patterns should be derived from the underlying TINs at a higher point density resolution.
Description
Polygonal areas describing the number of LiDAR bare-earth elevation points per unit area.
The density value is provided as both a quantitative value and a qualitative descriptor.
The strong variation in sample spacing due to vegetation and other factors requires that the density interpretation be generalized in order to present the data in a reasonable number of polygons per tile.
Layer information
| Layer Name | SURFACE_LiDARDigitalGroundModelDensity |
| Subject Category | Imagery |
| Title | 2003 LiDAR Digital Ground Model Point Density |
| Feature Count | 1 |
| Feature Type | Raster |
| Next Update | As needed |
| Spatial reference | None |
| Control ID | None |
| Place Keywords | Pacific NW, Snohomish County, King County, Washington State, WA, Southwestern Portion, Seattle |
| Theme Keywords | Data Voids, Bare-Earth, Lidar Digital Elevation Data, Point Data Density, Elevation Control, Virtually Deforested, Digital Ground Model (DGM), Elevation |
| Supplemental Information |
Density interpretations are derived from both the Puget LiDAR Consortium data as well as the King County ESA/SAO project data. Various filtering and smoothing algorithms applied to the randomly-spaced data by each respective vendor may have an effect on the resulting density interpretation. The density data is available in the same tiling scheme as the the primary bare-earth digital ground elevation data (dgm). The King County tile scheme is based on the underying PLSS as described by the idxptrmbr tile index. Individual tiles are identified as TxxRxx_den. |
Attribute information
|
OBJECTID
From Esri |
Description
Internal feature number. DomainSequential unique whole numbers that are automatically generated. |
|
Shape
From Esri |
Description
Feature geometry. DomainCoordinates defining the features. |
|
Shape_Length
From Esri |
Description
Length of feature in internal units. DomainPositive real numbers that are automatically generated. |
|
Shape_Area
From Esri |
Description
Area of feature in internal units squared. DomainPositive real numbers that are automatically generated. |
|
MosaicID
No Source Noted |
Description
Not Found DomainNot Found |
Contact information
| Maintained by | KCGIS Center |
| Primary |
KCGIS Center
giscenter@kingcounty.gov |
Terms of Use
| License | Terms of use and copyright |
Summary
Serves as a guide to the amount of elevation control that was provided by the randomly-spaced elevation sample points.
Production elevation models are provided as interpolated lattices based on a standard posting distance.
These models do not provide information about the initial data point density used to derive the model.
The density data can be use to inform the user as to the amount of LiDAR control in a given area, where data voids occur, and some general information about vegetation canopy density.
Detailed investigations regarding LiDAR penetration rates and more accurate point density patterns should be derived from the underlying TINs at a higher point density resolution.
Description
Polygonal areas describing the number of LiDAR bare-earth elevation points per unit area.
The density value is provided as both a quantitative value and a qualitative descriptor.
The strong variation in sample spacing due to vegetation and other factors requires that the density interpretation be generalized in order to present the data in a reasonable number of polygons per tile.
Contact information
| Maintained by | KCGIS Center |
| Primary |
KCGIS Center
giscenter@kingcounty.gov |
Terms of use and copyright
| License | Terms of use and copyright |
Change history
| 1/1/2003 |
King County Density Process Step 1: After receipt from 3di Technologies, the data media was cataloged, and the media contents were logged. The ASCII files were retiled into the King County idxp7500 tiling scheme. This resulted in creation of larger files where several 1 x 1 km 3di tiles were appended and clipped to form one 7500 ft x 7500 King County tile. The ASCII records were also appended with a integer identifier resulting in a final record format of identifier, easting, northing, and elevation value. |
| 1/1/2003 |
King County Density Model Process Step 1: ArcInfo TINARC-point all idxp7500 TINs that comprise a township-range tile ArcInfo GRID POINTDENSITY tin # # SIMPLE,3.208,circle,17.7 to generate a grid interpretation of the point density Tins, and thus pointdensity grids, extend 100 ft beyond input idxp7500 tiles. ArcInfo GRID GRIDCLIP used to clip back only 25 overlap with adjacent tiles to remove lower density areas due to edge effect Resulting idxp7500 grids are GRID MERGED to form composite grid of density values. Merged grid GRID RECLASSED using pre-defined remap table to reduce continuous range of data values to discrete 4 classes. GRID BOUNDARYCLEAN function with ASCEND, TWOWAY arguments used to aggregrate and regroup pixel clusters into a reduced number of zones. For composite grids that have NODATA areas, a NULL mask applied. Final grids created by clipping merged grids to exact idxptrmbr tile bound. GRIDPOLY used to convert grid to polygon Attributes added to PAT and populated PROJECTDEFINE used to define projection header Coverage exported as shapefile. |
| 1/1/2003 |
King County Density Process Step 2: The retiled ASCII point files were AWKed to output .gen files of the format: 1, easting, northing, elevation. The constant value of 1 was used to indicate that all points should be treated as mass points. Digital Ground Model (bare-earth) .gen files were built for input to the TIN creation function. The .gen files included all points of the subject tile plus a 100-foot buffer of all adjacent tiles. The composite ASCII .gen file was AWKed to create an output file of form: 1,easting, northing, elevation. The constant value of 1 is used to indicate that all points should be treated as Masspoints during the tinning process. The retiled ASCII point files were built into TINs using ArcInfo CREATETIN command with no (0.0) proximity tolerance. |
| 1/1/2002 |
Vendor (Intensity) Production Step 1: LiDAR data processing was used to produce the x,y,z elevation points using vendor proprietary lidar data processing software. Within this integrated process an atmospheric correction was made, which is especially important in regions of relatively low elevation. |
| 1/1/2002 |
Vendor (Intensity) Production Step 2: Data by flight line was combined in a merge process that eliminates redundant points. Data was also clipped into more manageable one km x one km bounds. Noise or anomalous returns were filtered from all data during this processing step. The data was quality checked using commercial software, Spectra Precision TerraModel and TerraVista. |
| 1/1/2002 |
Vendor Production Step 3: All elevation data was processed on a point by point basis for ellipsoid to orthometric height conversion using the National Geodetic Survey (NGS) Geoid Model, GEOID99. Datum and coordinate system conversion from WGS84 to the Washington State Plane coordinate system was performed using U.S. Army Corps of Engineers CorpsCon software algorithms. |